July 24, 2026 Market Recap & Outlook: Oil Crosses $100 as the War Finds a Second Sea. Tesla and Alphabet Rattle the Megacaps.
A retirement plan involves more than investments alone.
Let's talk
about how the different pieces of your retirement plan can work together.
Image credit: YahooFinance.com
The July 24, 2026 Market Recap saw investors navigate rising oil prices, geopolitical uncertainty, major corporate earnings, and renewed questions surrounding Federal Reserve policy. The conflict expanded to the Red Sea as Houthi militants declared a maritime embargo and attacked Saudi tankers, pushing Brent crude above $100 per barrel for the first time since early June and sending bond prices lower ahead of this week’s Federal Reserve meeting.
At the same time, Tesla’s disappointing earnings and Alphabet’s increased spending weighed on the largest technology stocks, even as much of the broader market remained resilient. Over the weekend, the United States paused its strikes on Iran following reports that an Omani delegation had arrived in Tehran, adding another layer of uncertainty for investors as markets prepared for a pivotal week.
Market Recap & Outlook
Your Weekly Market Compass –July 24, 2026
The war found a second sea this week, and the oil market repriced accordingly. Yemen’s Houthi militants, allied with Iran, declared a maritime embargo on Saudi shipping and struck Saudi tankers in the Red Sea, the alternative export route that had allowed the kingdom to work around the disrupted Strait of Hormuz. Brent crude, already climbing through July, crossed $100 per barrel on Thursday for the first time since early June and finished the month up roughly 40%. The bond market absorbed the inflation implications directly: the Bloomberg US Aggregate fell 0.7% and turned negative for the year, the 20+ Year Treasury index dropped 1.5%, and futures markets lifted the odds of a rate hike at this week’s Federal Reserve meeting to roughly 33%. Equities held up comparatively well, with the S&P 500 down 0.6%, but the damage was concentrated where it has been all month: Tesla suffered its worst session in more than a year after a profit collapse, Alphabet’s spending plans spooked investors despite solid results, and the Russell 1000 Growth index slipped to a negative return for 2026.
Then the weekend delivered the week’s most intriguing development. After thirteen consecutive nights of strikes on Iranian targets, the United States paused its campaign on Friday night and again Saturday, reportedly hours after an Omani delegation arrived in Tehran to discuss reopening the Strait of Hormuz. The White House offered no public explanation, but a senior administration official said the President’s preference has always been diplomacy. The pause in the Gulf came even as the Red Sea burned: on Saturday, July 25, the Houthis fired missiles and drones at Saudi Aramco facilities at Jizan and Yanbu, setting the Jizan refinery ablaze in the first direct Houthi attack on Saudi oil infrastructure in four years. Markets open this week facing a Federal Reserve decision, three megacap earnings reports, and a conflict that is somehow de-escalating and widening at the same time.
Geopolitical Watch & Energy Markets
The Red Sea Ignites: Houthis Target the Saudi Workaround
For most of this conflict, one thing has limited the damage to global oil supply: Saudi Arabia’s ability to route exports through the Red Sea rather than the Strait of Hormuz. This week that workaround came under direct attack. The Houthis declared a maritime embargo on Saudi-linked shipping and struck two Saudi oil tankers in the Red Sea on Wednesday and Thursday, setting a fire aboard the tanker Encelia roughly 70 nautical miles southwest of Saudi Arabia, with all crew reported safe. Five Saudi tankers diverted course, Saudi oil loadings through the Bab el-Mandeb passage dropped by roughly 36%, and the supply lifeline that had steadied the market since February was suddenly in question.
| $100 Brent | First time since early June | +~40% in July Oil Crosses the Century Mark | -36% Bab el-Mandeb loadings disrupted Saudi Red Sea Exports | 13 Consecutive nights through July 23 U.S. Strike Campaign on Iran | Paused July 24-25 | Omani delegation in Tehran U.S. Strikes Status |
The escalation carried a diplomatic subplot. On Wednesday, the United States signed a civilian nuclear power agreement with Saudi Arabia, deepening the alignment between Washington and Riyadh at the very moment Washington seeks to constrain Iran’s nuclear program. Analysts characterized the net effect as escalatory, and the Houthi embargo declaration followed within a day. By Thursday, Brent had pushed above $100 for the first time in nearly two months, and one senior commodities strategist warned that supply tightness is only going to worsen. The United States, meanwhile, completed its twelfth and thirteenth consecutive nights of strikes on Iranian targets, focused on degrading Iran’s ability to attack shipping in the Strait of Hormuz, before the campaign abruptly went quiet.
- Wednesday, July 22
The United States signs a civilian nuclear power agreement with Saudi Arabia. The Houthis declare a maritime embargo on Saudi-linked shipping. U.S. strikes on Iran continue nightly.
- Wednesday–Thursday, July 22–23
Houthi forces strike two Saudi oil tankers in the Red Sea, setting a fire aboard the Encelia. Five Saudi tankers divert course. Brent crude crosses $100 on Thursday for the first time since early June.
- Friday, July 24
The U.S. strike campaign against Iran pauses after thirteen consecutive nights, reportedly ordered hours after an Omani delegation arrived in Tehran to discuss reopening the Strait of Hormuz. The naval blockade remains in effect.
- Saturday, July 25
The Houthis fire dozens of missiles and drones at Saudi Aramco facilities in Jizan and Yanbu, setting the Jizan refinery ablaze in the first direct Houthi attack on Saudi oil infrastructure in four years. The Saudi-led coalition strikes Houthi launch sites and depots across Yemen. U.S. strikes on Iran remain paused for a second night.
- Sunday, July 26
The skies over Iran stay quiet for a second successive morning. Pakistani officials describe a constructive diplomatic role in facilitating negotiations, though their condition of a halt to attacks on Gulf states stands in tension with the weekend’s Red Sea salvos.
De-escalating and Widening at Once
The weekend of July 25-26 presented markets with two contradictory signals. In the Gulf, the U.S. strike pause and the Omani channel in Tehran represent the most tangible diplomatic opening since the ceasefire collapsed in early July. In the Red Sea, the Houthi attacks on Aramco’s Jizan and Yanbu facilities widened the war to Saudi soil, threatened the kingdom’s western export gateway, and raised the risk of reigniting Yemen’s civil war, with both sides reportedly mobilizing along the old front lines. Oil traders must now price a genuine peace possibility and a genuine second-front escalation simultaneously. Monday’s open will render the market’s first verdict on which weighs more.
Corporate Earnings
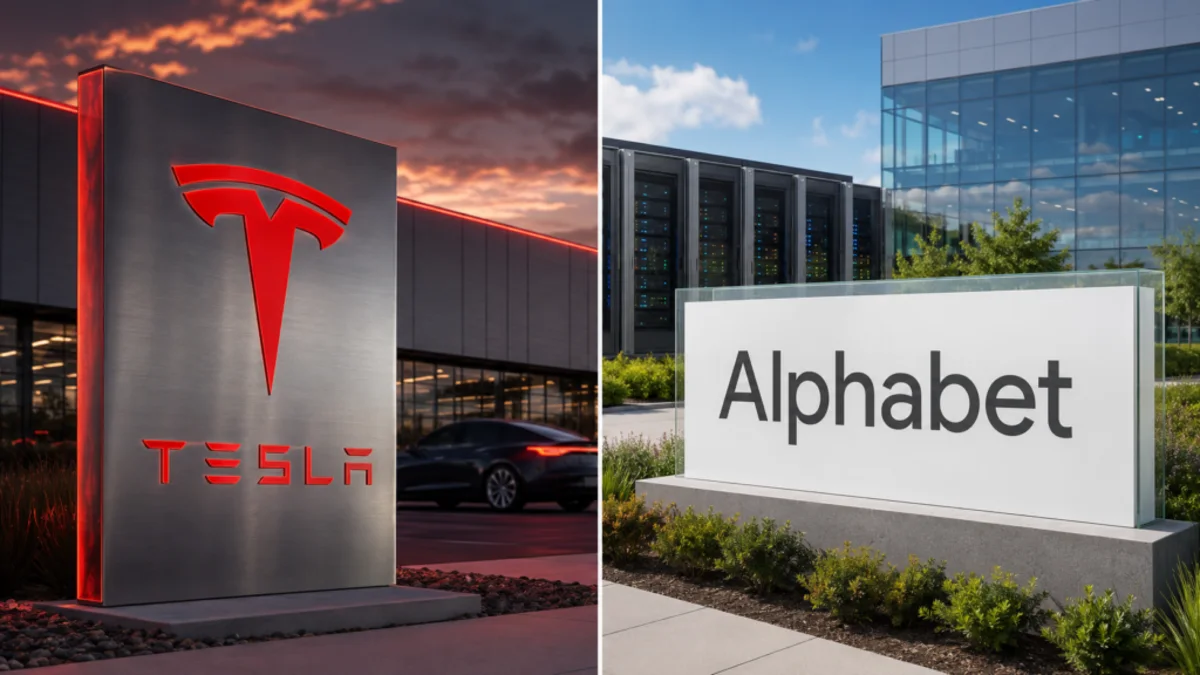
Tesla Stumbles, Alphabet's Spending Spooks, the Season Stays Strong
Earnings season reached the megacaps this week, with 77 S&P 500 companies reporting, and delivered the season’s first genuine disappointments. The paradox is that the broad season remains excellent: roughly 88% of reporting companies have exceeded earnings expectations, and blended second-quarter earnings growth is tracking at 37.9%, inflated by a one-time $98 billion gain in Alphabet’s results, or a still-remarkable 25.9% excluding it. But the two most-watched reports of the week, Tesla and Alphabet on Wednesday evening, both rattled investors, and the Magnificent Seven complex fell more than 5% for the week even as semiconductor ETFs recovered ground.
The week’s pattern extended last week’s message with a twist. In mid-July, the market punished chipmakers and spared the AI spenders; this week it punished the spenders, Tesla and Alphabet among them, while the semiconductor complex stabilized and ended higher. IBM added to the bruising after preliminary figures sent its stock plunging ahead of its report. The rotation within technology, from those writing the AI checks to those cashing them and back again, has become the market’s dominant internal dynamic. What has not changed is the aggregate: earnings are growing near 26% even setting aside Alphabet’s one-time gain, beats are running well above historical averages, and the weakness remains a valuation and expectations story rather than a fundamental one.
A season in which 88% of companies beat estimates and the market’s biggest names still fall is telling you what is priced in. For the megacaps, good is no longer good enough, and the bar for this week’s reports from Meta, Microsoft, Amazon, and Apple has been reset by Alphabet’s reception. Meanwhile the other four hundred stocks are quietly having an excellent earnings season.
−57% Tesla | GAAP Operating Income (YoY)
Tesla’s second quarter laid bare a difficult trade: revenue of $28.24 billion beat the $25.71 billion consensus on record deliveries, but adjusted earnings of $0.33 per share fell far short of the roughly $0.49 expected. Operating income dropped 57% year-over-year to $398 million, compressing the operating margin to 1.4%. The stock closed at $319.69 Thursday, its worst single-session percentage loss in more than a year.
+0.8% Alphabet | Year-to-Date Return After Report
Alphabet’s results were solid on the surface, lifted by a one-time gain of $98 billion that made it the largest contributor to the index’s earnings growth this quarter, but its raised spending plans and negative free cash flow spooked a market already anxious about AI capital intensity. The stock sank and dragged the broader market with it, leaving shares up just 0.8% for the year. The reaction sets the stakes for Meta, Microsoft, and Amazon, all reporting this week, where investors will scrutinize every capital-spending line.
Economic Backdrop
Bonds Sell Off Hard as Oil Rekindles the Inflation Trade
The bond market had the week’s clearest reaction to oil’s return above $100. Yields rose across the curve, and the damage ran through every corner of fixed income: the Bloomberg US Aggregate fell 0.7% and turned negative for 2026 at −0.6%, the ICE US Treasury 20+ Year index dropped 1.5% to −2.3% for the year, municipals fell 1.0%, TIPS lost 0.7%, and even corporate high yield declined 0.6%. Cash, up 2.1% year-to-date, is once again outperforming the entire investment-grade bond market. The safe-haven bid moved elsewhere: gold gained 1.0%, the dollar rose 0.9%, and Bitcoin added 1.9%.
| -0.7% Week | Now −0.6% YTD Bloomberg US Aggregate | -1.5% Week | Now −2.3% YTD ICE 20+ Year Treasury | ~33% Up from ~12% a week ago July Hike Probability | 37.9% Blended Q2 · 25.9% ex-Alphabet’s one-time gain S&P 500 Earnings Growth |
The move reflects a simple recalculation. Last week’s soft June CPI was built on June’s cheap gasoline; with Brent now above $100 and the Red Sea route compromised, the July and August inflation prints will carry the opposite energy impulse. Futures markets responded by lifting the probability of a rate increase at the July 28-29 Federal Reserve meeting to roughly 33%, nearly triple the odds of a week earlier. The Fed enters the meeting with a genuinely conflicted picture: headline inflation improving on lagged data, a labor market that slowed sharply in June, an earnings season confirming corporate health, and an energy shock that has now reignited twice in a month. The committee is widely expected to hold, but the statement and Chairman Warsh’s press conference carry unusual weight with no updated projections at this meeting.
The Fed’s Meeting Just Got Harder
A month ago the June dot plot’s nine hike projections looked like insurance against an energy shock that appeared to be fading. Oil above $100 with a second shipping route now under attack converts that insurance into a live debate. Yet hiking into a war-driven supply shock, with payrolls at 57,000 and mortgage demand frozen, risks compounding a slowdown the Fed cannot see clearly yet. The market’s 33% hike probability is less a forecast than a measure of genuine uncertainty. Warsh’s press conference on Wednesday is the week’s single most important event for the rate outlook.
Performance Data
Market Snapshot — Week Ending July 24, 2026
Index | Last Week | YTD 2026 |
|---|---|---|
Fixed Income & Alternatives — Total Return | ||
Bloomberg US Treasury Bills 1–3 Month | +0.1% | +2.1% |
Bloomberg US Government/Credit 1–3 Year | -0.2% | +0.7% |
Bloomberg US Aggregate | -0.7% | -0.6% |
Bloomberg Municipal 1–15 Year | −1.0% | -0.2% |
Bloomberg Municipal Bond High Yield | −0.9% | +2.5% |
Bloomberg US TIPS | −0.7% | +0.3% |
Bloomberg Global Aggregate | −0.7% | −1.4% |
Bloomberg US Corporate High Yield | −0.6% | +1.5% |
ICE US Treasury 20+ Year Total Return | −1.5% | −2.3% |
S&P/TSX North American Preferred Stock | −0.4% | +4.3% |
Bitcoin Price Return | +1.9% | −26.4% |
Global Equity — Total Return | ||
MSCI ACWI IMI Net Total Return | −0.3% | +10.1% |
MSCI ACWI Net Total Return | −0.3% | +9.8% |
Russell 3000 Total Return | −0.7% | +9.3% |
S&P 500 Total Return | −0.6% | +9.0% |
Russell 1000 Value Total Return | +0.1% | +19.0% |
Russell 1000 Growth Total Return | −1.5% | −0.3% |
Russell Midcap Total Return | 0.0% | +14.2% |
Russell Midcap Value Total Return | +0.2% | +18.9% |
Russell Midcap Growth Total Return | −0.7% | +0.2% |
Russell 2000 Total Return | −1.1% | +18.8% |
Russell 2000 Value Total Return | −0.4% | +23.1% |
Russell 2000 Growth Total Return | −1.7% | +14.8% |
MSCI EAFE Net Total Return | +0.5% | +9.4% |
MSCI Emerging Markets Net Total Return | +0.5% | +17.3% |
S&P 1500 Real Estate (Sector) | +1.0% | +17.4% |
Source: Goldstone Investment Research; data through July 24, 2026 close. All returns are total return unless otherwise noted. Index return data sourced from Goldstone Financial Group internal data systems as of July 24, 2026 close. GLD and UUP reflect fund net asset value performance. Bitcoin year-to-date return calculated from December 31, 2025 close ($88,414.63) to July 24, 2026 close ($65,033.02). The U.S. strike pause, the Houthi attacks on Saudi Aramco facilities at Jizan and Yanbu, and the Omani delegation’s arrival in Tehran occurred July 24-26, with the most significant developments after the close of the period covered. Past performance is not indicative of future results.
The internals tell the week’s story more clearly than the headline. Russell 1000 Growth fell 1.5% and now sits at −0.3% for 2026, a negative year-to-date return, while Russell 1000 Value held at +19.0%, a gap of more than 19 percentage points. International markets decoupled from the U.S. entirely, with developed markets up 0.5% and emerging markets up 0.5% against a falling S&P 500, and real estate added 1.0% to reach +17.4% for the year. The dispersion that has defined 2026 widened again, and once again the diversified side of the ledger absorbed the shock.
Looking Ahead
Key Events: Week of July 27, 2026
The week ahead is the most consequential of the summer: the Federal Reserve decision on Wednesday, three of the four largest megacap earnings reports within twenty-four hours of it, the first estimate of second-quarter growth, and June PCE inflation to close the week, all against a conflict at a genuine inflection point.
Date | Event & Description | Impact |
|---|---|---|
Jul 28–30 | FOMC Meeting · Warsh’s Second Decision
The committee is widely expected to hold at 3.50% to 3.75%, but futures assign roughly a 33% probability to a hike, nearly triple last week’s odds, after oil’s return above $100. No updated projections at this meeting, so the statement and Chairman Warsh’s Wednesday press conference carry the full signal on whether September remains live.
Meta, Microsoft, Amazon, and Apple Report
The heart of megacap earnings arrives Wednesday and Thursday, with Arm and Qualcomm alongside. After Alphabet’s spending plans sank its stock despite solid results, every AI capital-expenditure line will be scrutinized. The market’s tolerance for heavy investment without visible returns is the question of the season. | Highest Impact |
Jul 30 | Q2 GDP · Advance Estimate
The first official read on second-quarter growth, which the Atlanta Fed’s model has tracked near 2.5%. A solid print would confirm the economy carried momentum through the quarter’s turmoil; a miss would sharpen concerns raised by June’s weak hiring. | Moderate |
Jul 31 | June PCE Inflation · The Fed’s Preferred Gauge
June PCE should echo the CPI’s improvement, with the headline easing on the month’s cheap gasoline. As with CPI, the report describes an energy environment that no longer exists; the market will read it with oil above $100 in mind. | Moderate |
Ongoing | The Omani Channel vs. the Red Sea Front
The U.S. strike pause and the Tehran talks represent the most credible diplomatic opening in weeks, while the Houthi attacks on Aramco infrastructure threaten to widen the war and reignite Yemen’s civil war. Oil’s path, and with it the inflation and rate outlook, hangs on which track dominates. | Critical Watch |
Weekly Summary
What It All Means for Investors
The week ending July 24 compressed every 2026 theme into five sessions: an energy shock finding a new route, a bond market repricing inflation risk ahead of a Fed decision, megacap earnings punished despite a broadly excellent season, and a diplomatic channel opening just as a second front ignited. The S&P 500’s modest 0.6% decline concealed the widest divergence of the year, with large-cap growth now negative for 2026 while value, real estate, and international markets extended their leadership.
The year-to-date scoreboard after this week makes the case for breadth as plainly as it can be made. Russell 1000 Value at +19.0% and Russell 1000 Growth at −0.3% is a 19-point gap between two halves of the same large-cap market. Small-cap value leads everything at +23.1%, real estate has quietly climbed to +17.4%, emerging markets sit at +17.3%, and cash at +2.1% is beating the entire investment-grade bond market. A portfolio built on last cycle’s playbook, concentrated in large growth and long bonds, has spent 2026 absorbing shocks that a diversified allocation converted into gains.
The coming week will test that framework from every direction at once: a Fed decision with genuinely two-sided risk, megacap reports facing a reset bar, growth and inflation data describing a world that oil’s latest spike has already overtaken, and a conflict balanced between its best diplomatic opening and its widest escalation. We do not know which way each breaks. We do know that the discipline that has worked all year, owning the breadth of the market and rebalancing toward what the panic of the moment has left behind, does not require knowing. That remains our approach into a consequential week.
Oil above $100, a Fed decision with live hike odds, and the largest companies in the world reporting within hours of it: this is the kind of week that punishes concentration and rewards process. GoldstoneBuilder™ constructs portfolios across value, growth, small caps, real estate, international equity, and fixed income so that no single outcome, from a hawkish surprise to a diplomatic breakthrough, dictates your result. GoldstoneBalancer™ keeps your allocation aligned with your long-term objectives as the volatility unfolds. Clients with questions about positioning around the FOMC decision, megacap earnings, or the energy-driven inflation outlook are encouraged to reach out directly to their Goldstone advisor.
Disclaimer
Goldstone Financial Group, LLC (“GFG”) is a registered investment advisor with the U.S. Securities and Exchange Commission. Registration does not imply a certain level of skill or qualification. This material is provided for informational purposes only. Opinions expressed herein are solely those of GFG. None of the information presented in this material is intended to offer personalized investment advice and does not constitute an offer to sell or solicit any offer to buy a security or any insurance product, and is not intended to be used as the sole basis for financial decisions, nor should it be construed as advice designed to meet the particular needs of an individual’s situation. You cannot invest directly in an index, and those do not reflect the deduction of various fees that would diminish results. Any index or benchmark performance figures are for comparison purposes only, and client or strategy holdings will not directly correspond to any such data. Different types of investments involve varying degrees of risk, and there can be no assurance that any specific investment will either be suitable or profitable for your portfolio. All investment strategies have the potential for profit or loss and past performance is no guarantee of future success. Historical performance results for investment indexes and/or categories, generally do not reflect the deduction of transaction and/or custodial charges or the deduction of an investment-management fee, the incurrence of which would have the effect of decreasing historical performance results. Diversification and asset allocation do not assure a profit or protect against loss. Economic factors, market conditions, and investment strategies will affect the performance of any portfolio and there are no assurances that it will match or outperform any particular benchmark.
This communication is for informational purposes only and does not constitute investment advice, a solicitation, or an offer to buy or sell any security. Past performance is not indicative of future results. Investing involves risk, including the possible loss of principal. The views expressed reflect those of Goldstone Financial Group as of the date of publication and are subject to change without notice. Index returns shown are total returns unless otherwise noted and cannot be invested in directly. All index return data is sourced from Goldstone Financial Group internal data systems as of the July 17, 2026 market close. GLD and UUP performance reflects fund net asset value returns. Bitcoin year-to-date performance is calculated from the December 31, 2025 closing price of $88,414.63 through the July 17, 2026 closing price of $63,788.93. Economic data, including Consumer Price Index, import prices, housing, manufacturing, and Federal Reserve surveys, is sourced from the U.S. Bureau of Labor Statistics, the Federal Home Loan Bank of New York weekly market update, and CME Group, with releases dated July 14-17, 2026. Corporate earnings data is sourced from company earnings releases, IG, CNBC, Charles Schwab, and TheStreet, July 14-17, 2026. Geopolitical developments are sourced from the Associated Press, Britannica, International Crisis Group, Axios, Trading Economics, Charles Schwab, and TheStreet, July 13-19, 2026. Events occurring on July 18-19, 2026, after the close of the trading period covered in this recap, are included for informational context only and were not reflected in market performance during the reporting period. Clients should consult with their Goldstone Financial Group advisor before making any investment decisions.
Investment Advisory Services offered through Goldstone Financial Group, LLC, a Registered Investment Advisor. GoldstoneBuilder™ and GoldstoneBalancer™ are proprietary planning and portfolio management tools of Goldstone Financial Group, LLC.