September 25, 2026 Market Recap & Outlook: Yields Break to 2007 Highs. Stocks Shrug. Iran’s Seven-Day Plan.
A retirement plan involves more than investments alone.
Let's talk
about how the different pieces of your retirement plan can work together.
Image credit: Getty Images
Rising interest rates and the stock market are creating an unusual dynamic as Treasury yields reach levels not seen since 2007 while major stock indexes continue to climb.
In this week’s Market Recap & Outlook, Matthew Rice, CFA, CAIA, Chief Investment Officer at Goldstone Financial Group, examines what’s driving the divergence, along with shifting oil markets, developments in the Middle East and a new U.S.-China trade agreement. With key inflation and employment data ahead, several major forces could shape the market conversation heading into October.
Market Recap & Outlook
Your Weekly Market Compass – September 25, 2026
The 10-year Treasury yield surged past 5.2% for the first time in nineteen years as hot economic data, hawkish Fed commentary, and a weak auction pushed the odds of an October hike toward 70%. Stocks rallied anyway behind the biggest technology names. In the same five days, Iran’s foreign minister presented the war’s most concrete peace framework, Saudi oil exports hit their highest level since the fighting began, and a state visit by China’s president produced a $60 billion tariff-reduction agreement that the bond market’s drama nearly drowned out.
HIGHEST SINCE 2007
~50% A WEEK AGO
+80% VS. AUGUST
The bond market spent the week telling investors that the price of money is still going up, and the stock market spent the week refusing to listen. The 10-year Treasury yield climbed from 5.01% to 5.18% by Thursday and touched 5.225% intraday Friday, its highest since 2007, with the 30-year briefly at 5.53% and the two-year above 4.90%. The catalysts were an economy refusing to slow, led by a flash composite PMI of 58.4, the strongest business activity reading in more than five years, hawkish commentary from Fed officials including New York’s John Williams, who called another hike this year a reasonable way to think about it, and soft demand at a 7-year Treasury auction. Futures markets pushed the odds of an October rate increase to roughly 70% from about 50% a week earlier. Equities rallied through all of it, with Monday’s semiconductor-led surge carrying the Nasdaq to a record and the S&P 500 finishing the week up 1.2% at 7,743, even as bonds absorbed another beating: municipals fell 1.6% in their fourth straight losing week, long Treasuries dropped 2.3%, and gold’s 1.9% decline turned it negative for the year. Beyond the yield drama, the week quietly produced three developments that could matter more: Iran’s foreign minister presented a seven-day plan to end the war, Saudi Arabia’s exports reached 6 million barrels per day, the most since the conflict began, and President Xi Jinping’s first state visit to Washington yielded a $60 billion tariff-reduction agreement. Brent slipped below $98, and Bitcoin surged 10.5%.
Rates & the Stock Market
The 5% World: Yields at Nineteen-Year Highs, and the Stocks That Refused to Care
Wednesday broke the seal. S&P Global’s flash composite PMI jumped to 58.4 from 56.0, a five-year high for business activity with input-cost inflation a worrying detail inside it, and the 10-year yield closed at 5.11%, above 5.1% for the first time in nineteen years. The pressure kept building from every direction: Fed Governor Michael Barr said further policy adjustments are likely to be needed to ensure inflation comes down in a timely fashion, New York Fed President John Williams, arguably the year’s most dovish official, endorsed the case for another 2026 hike, and Thursday’s 7-year auction met soft demand. By Friday the 10-year had touched 5.225% intraday, a move of more than 20 basis points in a single week, and October hike odds stood near 70%. The composition of the move carried the important signal: of the 20-basis-point rise in the five-year yield, analysis by Washington Trust found 18 basis points came from higher real yields rather than inflation expectations, meaning the market repriced growth and Fed policy, not a loss of faith in the inflation fight.
week earlier
from 56.0
~50%
caps −0.8%
The stock market’s response inverted the textbook. Monday delivered the week’s decisive session, with the S&P 500 up 1.5% and the Nasdaq up 2.3% to a record close led by semiconductors, and Friday closed the week with the Dow up 479 points and the S&P 500 at 7,743.41 despite the yield surge, the second consecutive week stocks have ignored the bond market. The rally’s narrowness was the tell: large growth gained 2.4% while large value finished flat, small caps fell 0.8%, and real estate dropped 1.3%, a market paying up for the handful of companies whose earnings power looks immune to a 5% discount rate while repricing everything else beneath them. Memory chipmaker Micron, up roughly 17% from its mid-September low ahead of Wednesday’s earnings report, embodied the divide: the AI trade’s cash flows keep arriving, and until the cost of money visibly dents them, equity investors have chosen to believe the earnings over the yields.
Geopolitical Watch & Energy Markets
A Seven-Day Plan, Six Million Barrels, and Oil Below $98
The war’s diplomacy produced its most concrete framework yet. On Friday, Iran’s foreign minister presented a seven-day plan: fighting halts, the United States lifts its naval blockade and oil sanctions with frozen Iranian assets released, the Strait of Hormuz reopens at the end of day seven, and nuclear talks follow. The proposal arrived with the strait itself nearly empty, as commodity transits fell to single digits by Thursday, with maritime tracker Windward counting just 10 inbound and 2 outbound vessels on Wednesday, the same day a cargo ship was struck and set afire in the strait. The Houthis’ hold on Yemen’s Red Sea coastline and the Bab el-Mandeb persists, and the East-West pipeline remains under repair. Yet crude fell: Brent finished the week below $98, because Saudi Arabia’s improvised export machine kept scaling. Riyadh shipped 6 million barrels per day in September, its highest volume since the war began and a surge of nearly 80% over August’s 3.4 million, built on the shuttle-and-transfer system operating beyond the strait that we detailed last week. At the pump, the war’s costs remain fully in place, with the national average having reached $4.32 this month, up roughly 45% since February, and diesel setting records at mid-month; President Trump used the week’s other summit to ask China’s help on exactly that front, as detailed below.
Why Oil Fell in a Week Like This: A near-empty strait, a burning cargo ship, and a still-broken pipeline would ordinarily price crude higher, not lower. The difference is that the market has begun grading the war on flows rather than headlines, and the flows improved: Saudi volumes at a war-era high, the transfer system outside Hormuz proving durable, and now a peace framework specific enough to negotiate against. The seven-day plan’s terms, a blockade lifted for a strait reopened, are the first public articulation of what each side’s leverage is actually for. Whether Washington engages it determines if sub-$100 crude is the start of normalization or a pause between escalations.
Under the Radar
The Quiet One: The $60 Billion Trade Deal the Bond Market Drowned Out
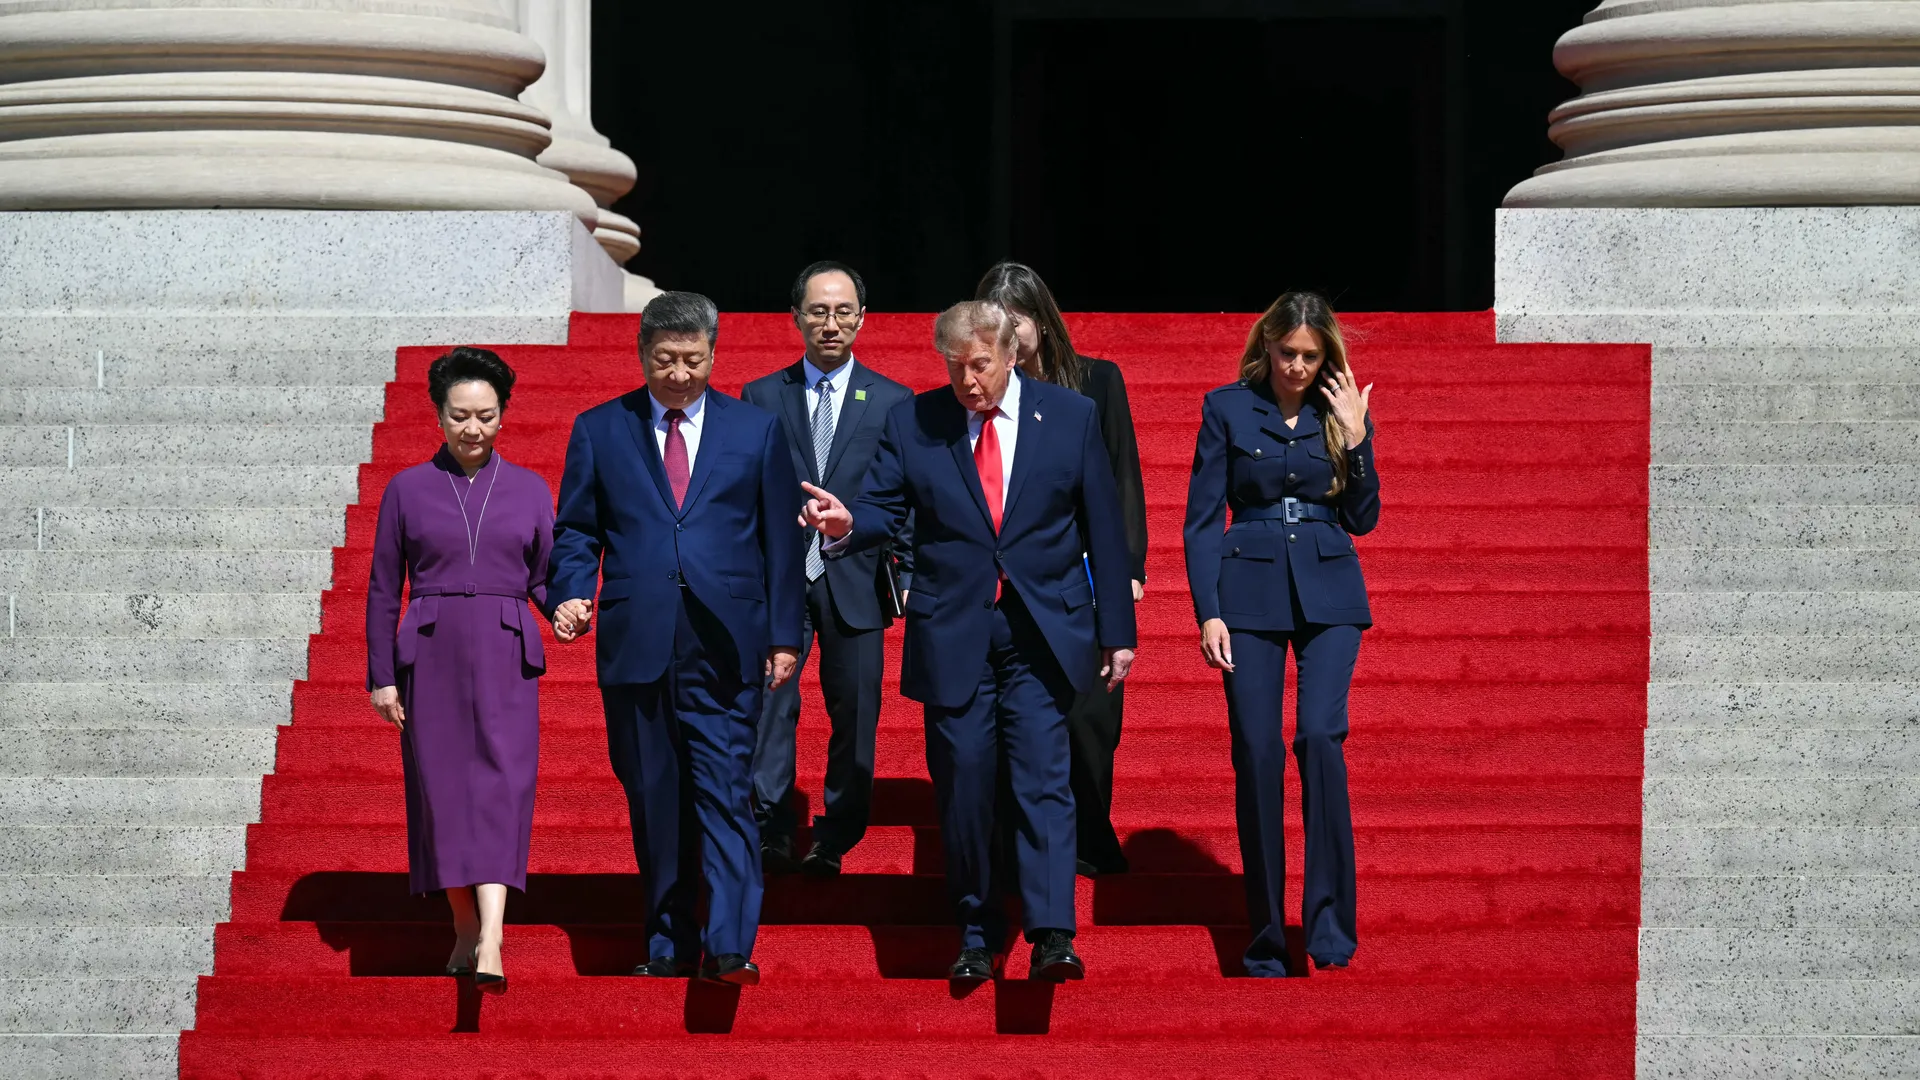
Trump and Xi agreed to work toward lowering tariffs on $60 billion of trade, $30 billion of each side’s imports, through a newly created U.S.-China Board of Trade, with both sides pausing tariff escalation until January 10. Sunday’s detailed list named 77 Chinese goods, from microwave ovens to toys and holiday decorations, and more than 1,600 U.S. products, from poultry and dairy to coal, recommended for lower tariffs. And the energy connection is direct: President Trump asked Xi for China’s help in lowering gasoline and diesel prices, a request aimed at Beijing’s restrictions on refined fuel exports that have been in place since the war’s early weeks to protect its domestic supply.
Why a Trade Thaw Could Move Markets Now
The agreement’s timing gives it outsized potential. Tariff reductions are a disinflationary force on goods prices arriving exactly as the Fed debates an October hike, and every tenth of a percent matters to a committee watching core inflation run above forecast. The larger lever is refined fuel: China is one of the world’s biggest producers of gasoline and diesel, and if Beijing relaxes the export restrictions it imposed in March, the relief would land directly on diesel, the single tightest product in the global fuel market and a record-setter in the U.S. this month. A goods list of fish hooks and holiday decorations reads as minor; a channel that reopens Chinese fuel exports and establishes a standing negotiating body two years into a trade war does not. With details still emerging and the escalation pause running to January 10, this is the story most likely to be repriced higher in importance by year-end.
Performance Data
Market Snapshot — Week Ending September 25, 2026
| Index | Last Week | YTD 2026 |
|---|---|---|
| Fixed Income & Alternatives — Total Return | ||
| Bloomberg US Treasury Bills 1–3 Month | +0.1% | +2.7% |
| Bloomberg US Government/Credit 1–3 Year | −0.1% | +0.6% |
| Bloomberg US Aggregate | −0.8% | −2.3% |
| Bloomberg Municipal 1–15 Year | −1.6% | −3.4% |
| Bloomberg Municipal Bond High Yield | −1.8% | −0.9% |
| Bloomberg US TIPS (Series–L) | −0.7% | −1.7% |
| Bloomberg Global Aggregate | −0.8% | −2.3% |
| Bloomberg US Corporate High Yield | −0.9% | +0.8% |
| ICE US Treasury 20+ Year Total Return | −2.3% | −6.2% |
| S&P/TSX North American Preferred Stock | −0.4% | +4.7% |
| SPDR Gold Shares (GLD) | −1.9% | −0.7% |
| Invesco DB US Dollar Index (UUP) | +0.8% | +5.9% |
| Bitcoin Price Return | +10.5% | −4.6% |
| Global Equity — Total Return | ||
| MSCI ACWI IMI Net Total Return | +0.8% | +14.2% |
| MSCI ACWI Net Total Return | +1.0% | +14.3% |
| Russell 3000 Total Return | +1.1% | +13.8% |
| S&P 500 Total Return | +1.2% | +14.1% |
| Russell 1000 Value Total Return | +0.0% | +21.2% |
| Russell 1000 Growth Total Return | +2.4% | +7.2% |
| Russell Midcap Total Return | +0.0% | +13.5% |
| Russell Midcap Value Total Return | −0.6% | +17.0% |
| Russell Midcap Growth Total Return | +1.7% | +2.3% |
| Russell 2000 Total Return | −0.8% | +15.3% |
| Russell 2000 Value Total Return | −1.1% | +19.2% |
| Russell 2000 Growth Total Return | −0.5% | +11.7% |
| MSCI EAFE Net Total Return | +0.2% | +10.9% |
| MSCI Emerging Markets Net Total Return | +1.3% | +25.2% |
| S&P 1500 Real Estate (Sector) | −1.3% | +6.9% |
Source: Goldstone Investment Research; data through September 25, 2026 close. All returns are total return unless otherwise noted. Index return data sourced from Goldstone Financial Group internal data systems as of September 25, 2026 close. GLD and UUP reflect fund net asset value performance. Bitcoin year-to-date return calculated from December 31, 2025 close ($88,414.63) to September 25, 2026 close ($84,377.97). The release of the U.S.-China tariff agreement’s detailed goods list occurred Sunday, September 27, after the close of the period covered. Past performance is not indicative of future results.
Looking Ahead
Key Events: Week of September 28, 2026
The week that decides October arrives: the Fed’s preferred inflation gauge lands Wednesday and the September jobs report Friday, with hike odds already near 70% and yields at nineteen-year highs.
Weekly Summary
What It All Means for Investors
The week’s defining fact is the divergence: a bond market pricing a 5% world with another hike on top, and a stock market making new highs anyway on the strength of its largest companies. Both can be right for a while, because AI-driven earnings growth above 25% genuinely can outrun a rising discount rate, but the gap between them is where the year’s remaining risk lives. Wednesday’s PCE report and Friday’s jobs number will test whether stocks can keep ignoring yields for a third week, and the answer matters most for the parts of the market, small caps, real estate, and long bonds, that have already been repriced by the move.
Fixed income deserves the direct word this week. The Aggregate is now down 2.3% for the year, municipals have fallen four consecutive weeks to −3.4%, and the 20+ Year Treasury index sits at −6.2%, painful marks for conservative allocations. The other side of that ledger is the highest starting yields in nearly two decades: nearly every Treasury maturity now trades at or above 5%, and the tax-exempt market’s repricing has pushed muni yields to levels that, for high-bracket investors, have not been available in years. While rising yields have produced near-term price declines, they also increase the income available on newly purchased bonds. Whether investors should adjust existing fixed-income positions depends on factors including duration, liquidity needs, tax considerations, investment horizon, and overall portfolio objectives. Meanwhile the year’s leadership held: emerging markets extended their lead at +25.2%, and the week’s narrow growth rally, however dramatic, leaves value’s 2026 advantage largely intact.
We enter the pivotal week positioned, not predicting. If PCE runs hot and October’s hike arrives, higher starting yields may provide greater income and potentially improve prospective fixed-income return characteristics, although bond prices could decline further if rates continue to rise; if the seven-day plan gains traction and oil’s retreat extends, the relief lands broadly across the international and value segments that lead the year. The one outcome we do not prepare for is the one that requires knowing in advance which it will be.
Yields at nineteen-year highs, an October hike near 70% priced, a peace plan on the table, and a trade thaw arriving through the noise: the quarter closes with every major market force in motion at once. GoldstoneBuilder™ is used to construct diversified portfolios across multiple asset classes and market segments based on a client’s investment objectives and risk profile. GoldstoneBalancer™ is designed to help maintain portfolio allocations consistent with clients’ long-term objectives.