October 30, 2026 Market Recap & Outlook: A Strong Economy, a Divided Fed, and a Hard Week for Big Tech.
A retirement plan involves more than investments alone.
Let's talk
about how the different pieces of your retirement plan can work together.
Image credit: Getty Images
The October 30, 2026 Market Recap & Outlook examines a consequential week for financial markets, as strong economic growth, a divided Federal Reserve, and significant declines among major technology companies reshaped investor expectations heading into November. While economic fundamentals demonstrated resilience, changing market leadership revealed an increasingly complex investment environment.
In this week’s analysis, Matthew Rice, CFA, CAIA, Chief Investment Officer at Goldstone Financial Group, examines the Federal Reserve’s decision to hold interest rates at 3.75%–4.00%, despite two officials voting in favor of an increase. The decision came alongside encouraging economic data, with third-quarter GDP expanding at an annualized rate of 3.4%, supported by strong consumer spending. Although quarterly inflation moderated, persistent price pressures continue to complicate the outlook for monetary policy.
Corporate earnings delivered another important development. Alphabet declined 12.6% and Intel fell 29%, reflecting growing investor scrutiny of artificial intelligence spending, corporate profitability, and future growth expectations. These developments highlight a shift in how markets are evaluating the substantial capital commitments associated with AI infrastructure.
Meanwhile, a broader rotation across financial markets continues to unfold. Large-cap value stocks have gained 24.5% year to date, compared with a 0.2% decline in large-cap growth. Small-cap equities, real estate, and fixed income also posted gains during the week, illustrating the widening performance differences across investment styles and asset classes.
Looking ahead, the November midterm elections, geopolitical tensions affecting energy markets, upcoming employment data, and the Federal Reserve’s December meeting introduce additional considerations for investors.
Through detailed market performance data and economic analysis, Matthew explores what these developments reveal about market concentration, diversification, interest rate expectations, and the changing sources of investment returns as the final months of 2026 approach.
Market Recap & Outlook
Your Weekly Market Compass – October 30, 2026
The Federal Reserve held rates with two of its own members voting to hike, the first estimate of third quarter growth came in at 3.4%, the fastest in a year, and then earnings season delivered its verdict on the AI buildout: Alphabet suffered the worst day in its history as a public company after reporting negative free cash flow, Intel’s bleak outlook produced its worst session in 52 years, and the Nasdaq closed October with its hardest day since June. Underneath, the rotation rolled on, with value, small caps, and bonds all rising again, large growth turning negative for 2026, and oil seesawing between a letter to Tehran and mines in the strait.
The year’s most compressed week delivered on every front, and the market sorted its verdicts with precision. The Federal Reserve held its target range at 3.75%-4.00% on a 10-2 vote Wednesday, with Governor Lisa Cook and Cleveland’s Beth Hammack dissenting in favor of a hike, and Chairman Warsh promising the Fed will deliver price stability with, in his words, no ifs, ands, or buts. Thursday’s data explained the dissents, as the advance estimate showed the economy growing at a 3.4% annualized pace in the third quarter, the fastest in a year. Then the earnings arrived, and the AI trade’s financing question got its answer from the largest companies in the world: Alphabet fell 12.6% Thursday, the worst day in its public history, after reporting negative free cash flow alongside $51.4 billion of quarterly capital spending, Amazon slid after its own cash outflow widened, and Intel’s weak outlook triggered a 29% Friday collapse, its worst session in 52 years, dragging the Nasdaq to its hardest day since June as October closed. The other market kept rising through it: value, small caps, mid caps, real estate, and bonds all gained for another week, large growth’s 2026 return turned negative, and oil finished roughly flat only because a genuine diplomatic opening, a letter from the Vice President to Tehran, offset fresh attacks on tankers. The midterm elections arrive Tuesday.
The Federal Reserve & the Economy
A 10-2 Hold Meets a 3.4% Economy
The Fed paused, and the argument moved inside the building. Wednesday’s decision to hold at 3.75%-4.00% drew dissents from Governor Lisa Cook and Cleveland President Beth Hammack, both preferring a quarter-point increase, and Chairman Warsh’s press conference leaned toward their logic even while defending the pause: the economy has strengthened, he said, inflation remains too high, the approaching midterms played no role in the decision, and the committee will deliver price stability without qualification. He noted first-half growth was revised up to 2.4% and called a slowdown scenario one that would make September’s weak jobs report look like a blip. Thursday’s data promptly sided with the hawks, as the Bureau of Economic Analysis’ advance estimate put third quarter growth at 3.4% annualized, above forecasts near 3.2% and up from 2.2% in the second quarter, powered by consumer spending rising 3.8% for a second straight quarter. The inflation detail inside the report offered the week’s genuine good news: the quarterly PCE price index slowed to a 2.1% annualized pace from 5.0% in the second quarter, with core at 2.5%, even as the year-over-year September reading held at 3.6%. An economy running at 3.4% with quarterly inflation decelerating toward target is the soft landing and the overheating argument at once, which is precisely why the committee split.
Corporate Earnings
Alphabet, Amazon, and Intel: The Week the Market Repriced AI's Cash Bill
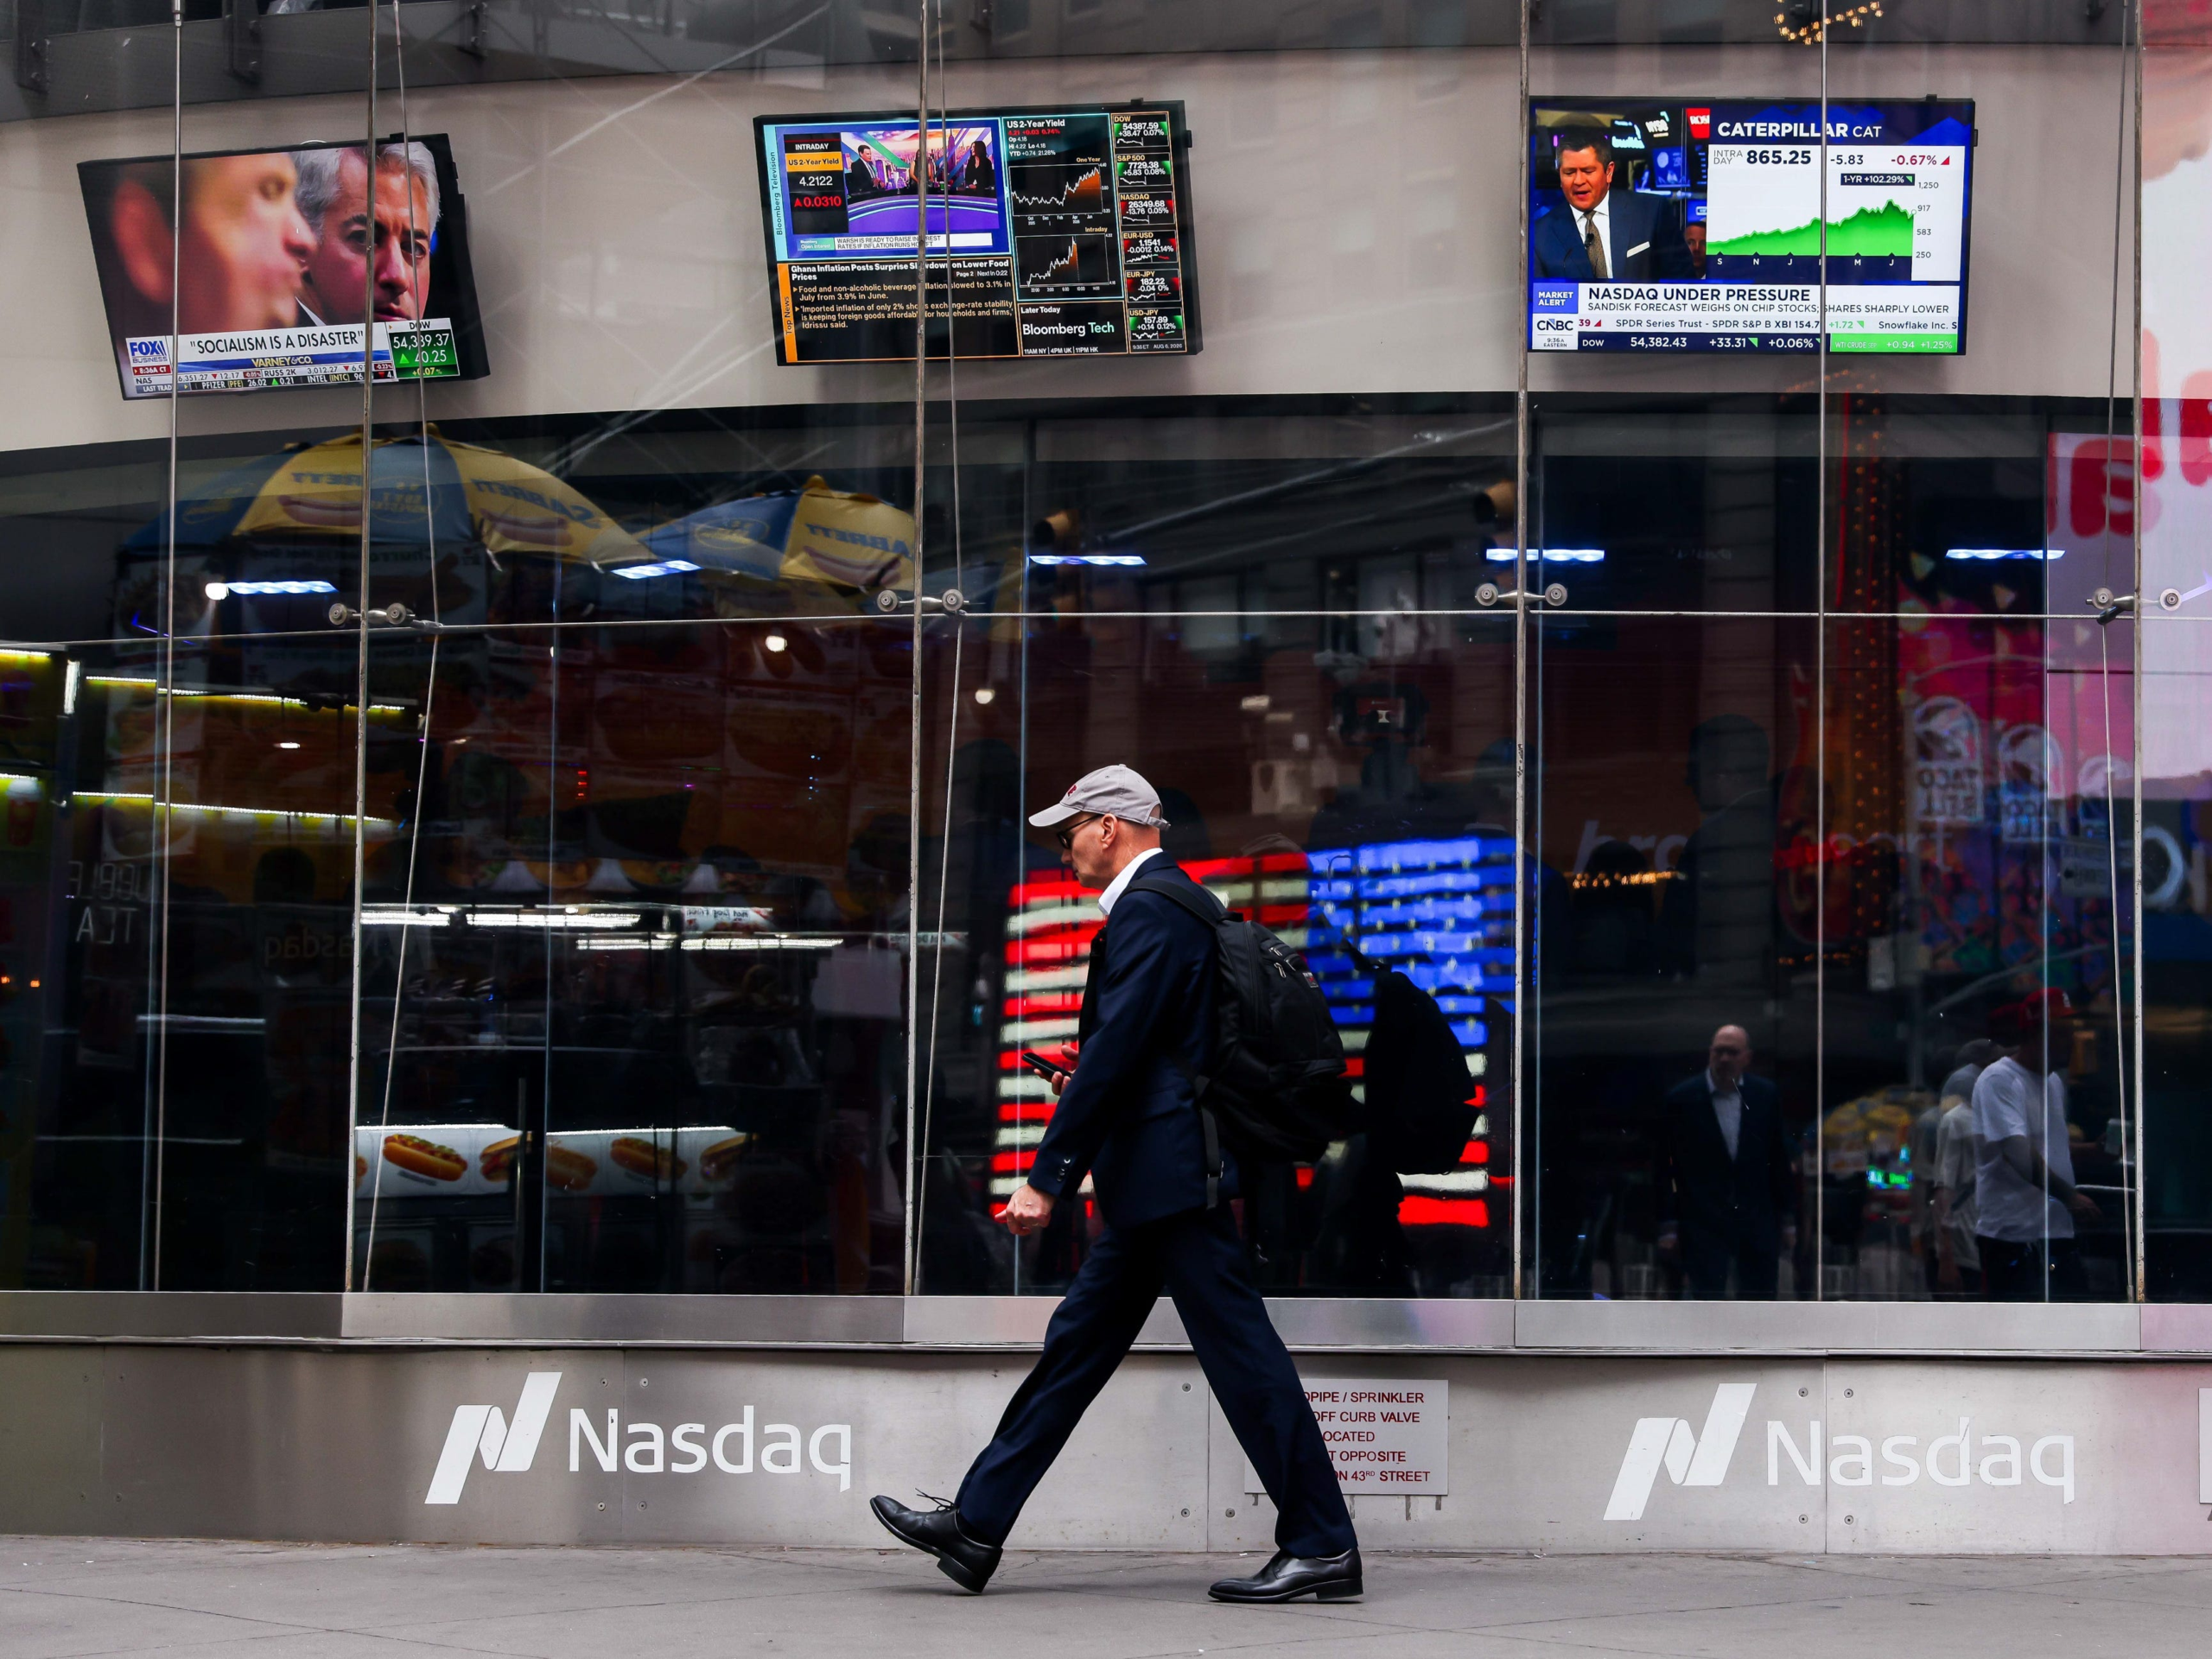
For two weeks, the market had been punishing AI spending in the abstract; this week it got the itemized bill from the companies writing the checks. Alphabet’s quarter contained spectacular demand, with Google Cloud revenue growing 103%, and a spectacular cost, with capital spending of $51.4 billion producing negative free cash flow of $9.1 billion, the company’s second consecutive quarter of burning rather than generating cash, alongside signals of higher spending in 2027. The stock fell 12.6% Thursday, erasing roughly half a trillion dollars of value in the worst single day of its public life. Amazon followed the same script, holding its 2026 capital plan near $220 billion while its trailing free cash flow swung to a $42.4 billion outflow, and the stock fell. Intel then supplied Friday’s capitulation, guiding fourth quarter revenue to $15 to $16 billion against expectations near $17 billion while warning of PC component shortages, a symptom of the AI buildout consuming the supply chain, and the stock collapsed 29%, its worst session since the 1970s, as the Nasdaq fell 3.3% in its hardest day since June.
What it means is best read through the exceptions. Microsoft reported the same night as Alphabet and rose, rewarded for cloud results that showed its spending already converting to revenue, and Oracle’s more muted capital outlook earlier in the week was treated as a positive catalyst. The market has not turned against artificial intelligence; it has started underwriting it like any other capital-intensive business, paying for demonstrated returns on spending and repricing promises of future ones, a shift sharpened by the financing backdrop, where data-center bond yields have reached about 7% and a record month of investment grade supply is expected in November. The clearest evidence that this is rotation rather than retreat came midweek, when 406 of the S&P 500’s members rose in a session the index itself fell, the first such day since 1996: the average American stock is being bought while the handful at the top absorb the repricing. Blended third quarter earnings growth remains near 29%, and the question the next phase of the season answers is whether the companies without nine-figure capital budgets can keep carrying it.
Energy & Geopolitics
A Letter and a Minefield: Oil's Flat Week Hides the Week's Biggest Swings
Crude ended the week nearly unchanged, with Brent at $113.10 and WTI at $104.12 Friday, but the stillness was two large forces canceling. The diplomatic force arrived Thursday, when reports revealed Vice President JD Vance had written to Iran’s Security Council chief Mohsen Rezaei proposing a path to direct negotiations, Tehran confirmed receiving the letter, and Iran’s foreign minister said the country welcomes efforts at talks, raising the possibility of accelerating the seven-day framework proposed in September; oil fell roughly 2% on the news, and Qatari mediators arrived in Tehran Friday as the Vice President set out parameters for direct talks. The escalatory force answered within a day: tankers were struck by mines and explosive devices on the bypass routes near Oman’s coast, Iran said four vessels were hit, maritime authorities logged 43 security incidents in the Gulf for October with 30 direct strikes on tankers, and reports that military commanders had briefed the President on renewed strike options, with a third carrier group deploying to the region, pushed crude back up 2% Friday. Brent finished October up roughly 12% at a six-month high, its fourth straight monthly gain, and diesel remains the household edge of it all, still near the records it set at $6.33 a gallon in mid-October. The election now sits directly on this seesaw, with the pre-midterm restraint on military action expiring Tuesday and both the negotiation track and the strike option waiting on the result.
The Midterm Elections
Two Days Out: The Vote That Unlocks Everything Waiting
Tuesday’s election has become the calendar’s hinge, with the strike-or-negotiate decision on Iran, the durability of the fuel-price relief program, and the political backdrop to December’s near-certain rate debate all queued behind it. The historical record we have carried through this stretch bears one final repetition at the threshold: per J.P. Morgan Asset Management, the S&P 500 has risen in the 12 months following every midterm election since 1950, averaging roughly 15%, and the fourth quarter of midterm years has averaged a 6.6% gain. However, these observations reflect a limited number of historical periods, and future market performance may differ materially. Political developments, economic conditions, monetary policy, and other factors can significantly influence investment returns. Yet, the past three weeks have illustrated the mechanism behind the pattern better than any backtest: through a trillion-dollar AI repricing, historic single-stock collapses, and a war’s weekly reversals, the broad market absorbed what the narrow market shed, and investors who stayed diversified and invested needed no forecast at all. We would expect election-week volatility and position for none of its outcomes in particular.
Performance Data
Market Snapshot — Week Ending October 30, 2026
| Index | Last Week | YTD 2026 |
|---|---|---|
| Fixed Income & Alternatives — Total Return | ||
| Bloomberg US Treasury Bills 1–3 Month | +0.1% | +3.1% |
| Bloomberg US Government/Credit 1–3 Year | +0.3% | +1.5% |
| Bloomberg US Aggregate | +0.6% | −0.5% |
| Bloomberg Municipal 1–15 Year | +0.7% | −0.2% |
| Bloomberg Municipal Bond High Yield | +0.3% | +1.8% |
| Bloomberg US TIPS (Series-L) | +0.5% | +0.4% |
| Bloomberg Global Aggregate | +0.3% | −1.3% |
| Bloomberg US Corporate High Yield | +0.5% | +0.4% |
| ICE US Treasury 20+ Year Total Return | +0.7% | −2.8% |
| S&P/TSX North American Preferred Stock | −1.1% | +1.4% |
| SPDR Gold Shares (GLD) | −3.0% | −10.2% |
| Invesco DB US Dollar Index (UUP) | +0.1% | +7.3% |
| Bitcoin Price Return | −4.3% | −12.0% |
| Global Equity — Total Return | ||
| MSCI ACWI IMI Net Total Return | −0.2% | +11.2% |
| MSCI ACWI Net Total Return | −0.3% | +11.2% |
| Russell 3000 Total Return | −0.5% | +11.7% |
| S&P 500 Total Return | −0.6% | +11.8% |
| Russell 1000 Value Total Return | +0.5% | +24.5% |
| Russell 1000 Growth Total Return | −1.7% | −0.2% |
| Russell Midcap Total Return | +0.5% | +15.4% |
| Russell Midcap Value Total Return | +1.0% | +22.0% |
| Russell Midcap Growth Total Return | −0.8% | −3.4% |
| Russell 2000 Total Return | +1.3% | +14.4% |
| Russell 2000 Value Total Return | +0.7% | +19.9% |
| Russell 2000 Growth Total Return | +1.9% | +9.3% |
| MSCI EAFE Net Total Return | +0.9% | +9.5% |
| MSCI Emerging Markets Net Total Return | −0.7% | +13.5% |
| S&P 1500 Real Estate (Sector) | +1.4% | +10.5% |
Source: Goldstone Investment Research; data through October 30, 2026 close. The market indices, exchange-traded products, and other assets presented reflect different investment exposures, methodologies, and risk characteristics and are not directly comparable. Index returns do not reflect investment management fees or expenses and cannot be invested in directly. Exchange-traded products may incur expenses that affect investment returns. Bitcoin and other digital assets involve substantial volatility and risks, including the potential loss of the entire investment. All returns are total return unless otherwise noted. Index return data sourced from Goldstone Financial Group internal data systems as of October 30, 2026 close. GLD and UUP reflect fund net asset value performance. Bitcoin year-to-date return calculated from December 31, 2025 close ($88,414.63) to October 30, 2026 close ($77,838.81). Past performance is not indicative of future results.
Looking Ahead
Key Events: Week of November 2, 2026
Election week arrives with the largest queue of deferred decisions of the year waiting on Tuesday’s result.
Weekly Summary
What It All Means for Investors
A week containing the worst day in Alphabet’s history and the worst Intel session in half a century ended with the S&P 500 down just 0.6%, and that arithmetic is the whole story: the market’s center of gravity has moved. Three weeks into the AI repricing, large growth is now negative for 2026 while value leads by nearly twenty-five points, bonds have climbed for four consecutive weeks with municipals nearly back to flat for the year, and the day 406 stocks rose while the index fell, unseen since 1996, captured the regime in a single session. The economy, growing at 3.4% with quarterly inflation decelerating, is giving the broad market fundamental cover to keep broadening.
The investor lesson of October is the one this year keeps teaching at larger scale: concentration is a decision, whether or not it was ever made deliberately. Portfolios that drifted into the market’s largest names over the past two years just experienced single-stock events, historic ones, inside what felt like an index allocation, while portfolios holding the full breadth spent the same month collecting gains from value, small caps, mid caps, real estate, international, and a recovering bond market. Gold’s continued slide, now down 10.2% for the year, and Bitcoin’s 12% deficit round out the reminder that every asset takes its turn, which is the argument for owning the set rather than guessing the sequence.
Election week will be loud, the Iran decision behind it louder still, and December’s Fed meeting looms with two members already voting for the hike. We enter all of it the way we entered October: positioned across the outcomes, rebalancing toward what the repricings cheapen, and confident that the discipline that just carried portfolios through the market’s most concentrated storm in years remains the right one for whatever Tuesday starts.
A split Fed, a 3.4% economy, historic single-stock collapses, and an election in two days: the market’s decisions are arriving faster than any forecast can track. GoldstoneBuilder™ is a proprietary portfolio construction tool designed to assist in developing diversified investment allocations across multiple asset classes and investment styles. GoldstoneBalancer™ is designed to support ongoing portfolio monitoring and rebalancing consistent with established investment objectives and allocation parameters. Clients with questions about their concentration in the market’s largest names, or their positioning into election week, are encouraged to reach out directly to their Goldstone advisor.
Disclosure:
Goldstone Financial Group, LLC (“GFG”) is a registered investment advisor with the U.S. Securities and Exchange Commission. Registration does not imply a certain level of skill or qualification. This material is provided for informational purposes only. Opinions expressed herein are solely those of GFG. None of the information presented in this material is intended to offer personalized investment advice and does not constitute an offer to sell or solicit any offer to buy a security or any insurance product, and is not intended to be used as the sole basis for financial decisions, nor should it be construed as advice designed to meet the particular needs of an individual’s situation. You cannot invest directly in an index, and those do not reflect the deduction of investment advisory fees or other expenses that would reduce the returns experienced by an investor. Any index or benchmark performance figures are for comparison purposes only, and client or strategy holdings will not directly correspond to any such data. Different types of investments involve varying degrees of risk, and there can be no assurance that any specific investment will either be suitable or profitable for your portfolio. All investment strategies have the potential for profit or loss and past performance is no guarantee of future success. Historical performance results for investment indexes and/or categories, generally do not reflect the deduction of transaction and/or custodial charges or the deduction of an investment-management fee, the incurrence of which would have the effect of decreasing historical performance results. Diversification and asset allocation do not assure a profit or protect against loss. Economic factors, market conditions, and investment strategies will affect the performance of any portfolio and there are no assurances that it will match or outperform any particular benchmark. Index performance is provided for illustrative purposes and does not reflect the performance of any client account. This communication is for informational purposes only and does not constitute investment advice, a solicitation, or an offer to buy or sell any security. Past performance is not indicative of future results. Investing involves risk, including the possible loss of principal. The views expressed herein reflect those of Goldstone Financial Group as of the date of publication and are subject to change without notice. Index returns shown are total return unless otherwise noted and are not available for direct investment.
Investment Advisory Services offered through Goldstone Financial Group, LLC, a Registered Investment Advisor. GoldstoneBuilder™ and GoldstoneBalancer™ are proprietary planning and portfolio management tools of Goldstone Financial Group, LLC.